The material here was developed during 2016 and 2019 for use in training. To request more information or provide feedback, please email us at pct@pct.bike or report issues on our GitHub issue tracker. The PCT also has a blog, which contains further information on some of the topics featured in the case studies and FAQs. Contributions to GitHub, the blog or other parts of the project are welcome.
FAQs
1. Does hilliness matter for cycling? Do the Dutch just cycle more because the Netherlands is flatter?
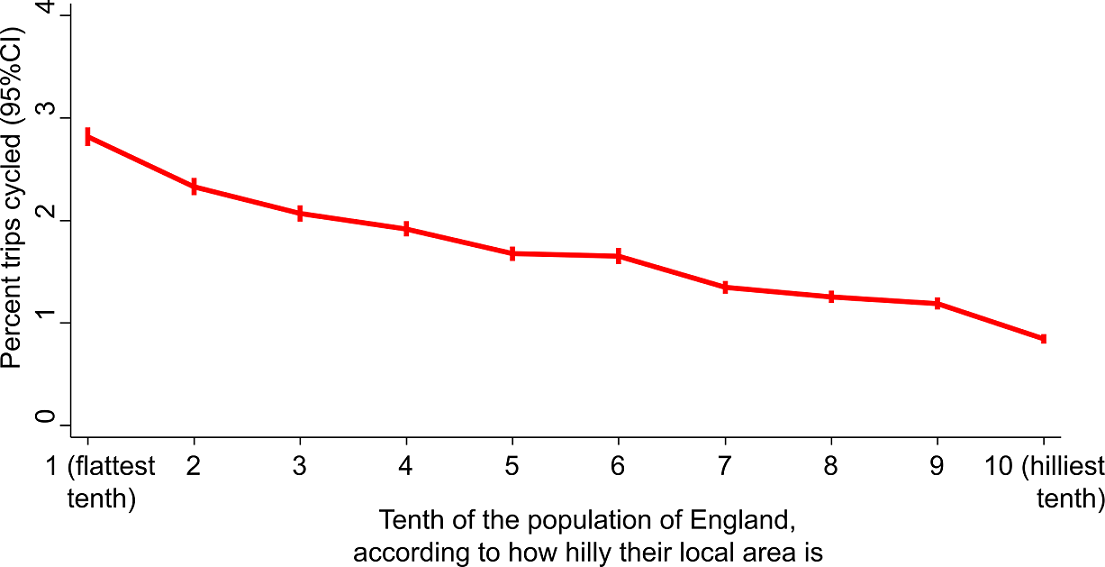
Hilliness is certainly an important predictor of cycling levels in England, with the probability of cycling a trip falling steadily as the hilliness of the local area increases (Figure 1.1). Overall, people in the tenth of the population in the flattest areas are three times more likely to cycle a trip than the tenth of people in the hilliest areas (2.8% trips cycled vs 0.8%).
|
|
Figure 1.1: Proportion of trips cycled in England, according to the hilliness of the local area
|
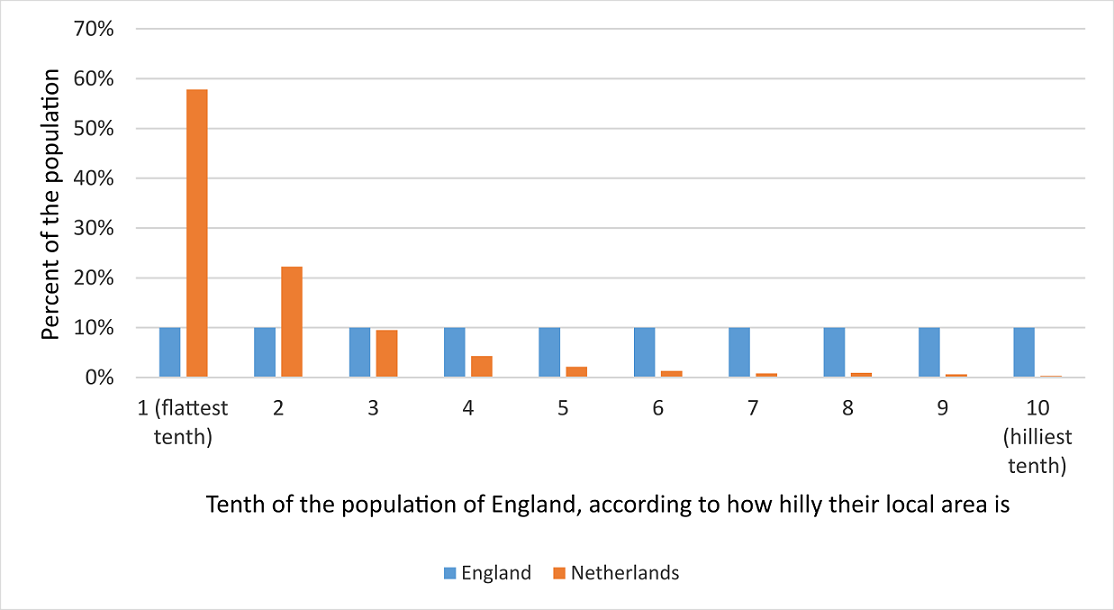
It is also true that the Netherlands is a flatter country than England. As illustrated in Figure 1.2, around 80% of people in the Netherlands live in areas that are below the 20th centile for local hilliness in England. Under 4% of people in the Netherlands in live in areas that are above the 50th centile for hilliness in England. Note that in both England and the Netherlands the local area is defined using administrative areas designed to contain populations of around 1500 individuals.
|
|
Figure 1.2: Distribution of the population of the Netherlands in terms of the hilliness of their local area, relative to the tenths defined in England.
|
We estimated what would happen to cycling levels in England if England had the same flat topography as the Netherlands (but the existing infrastructure, travel patterns and cycling cultures). We did this by re-weighting the cycle mode share shown in Figure 1.1 according to the Dutch distribution of hilliness shown in Figure 1.2 i.e. giving much more weight to the cycling levels of those living in the flattest parts of England than those living in the hilliest parts. In this “Dutch levels of hilliness” scenario, the proportion of trips cycled in England rose from 1.7% to 2.6%. This is still ten times lower than the mode share of 26.7% actually observed in the Netherlands. So although hilliness does explain a small part of why the English cycle less than the Dutch, it still leaves a massive difference unexplained. Or to put it another way, only if cycling levels in England were increased ten-fold would “the Netherlands is flatter” become a convincing excuse for England lagging behind.
2. How does propensity to cycle differ between England and the Netherlands?
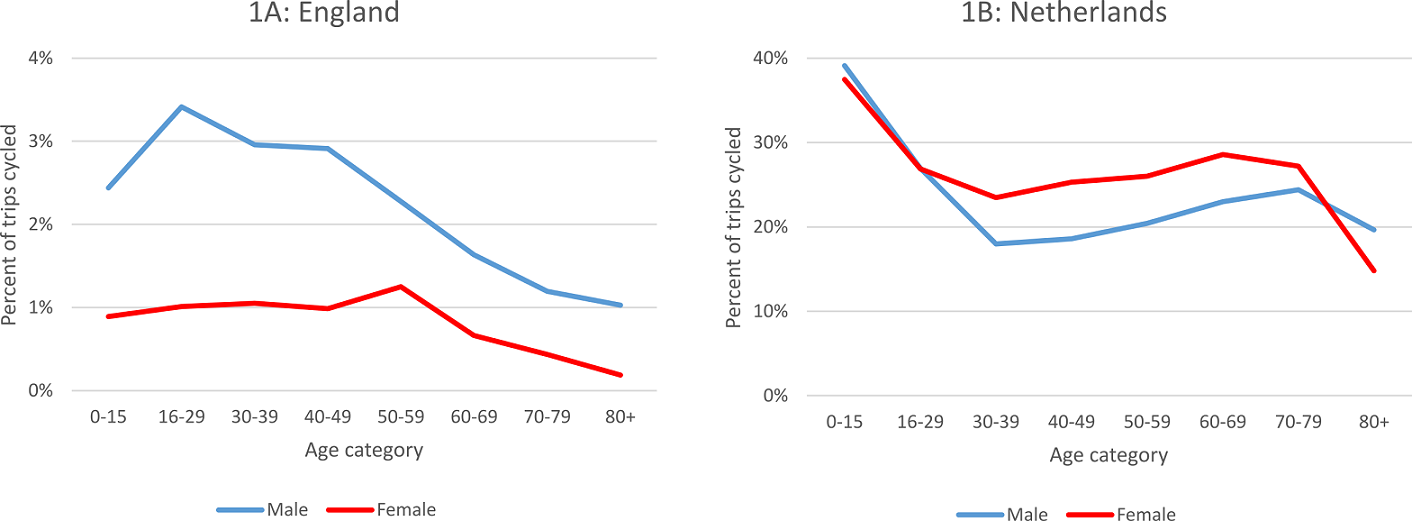
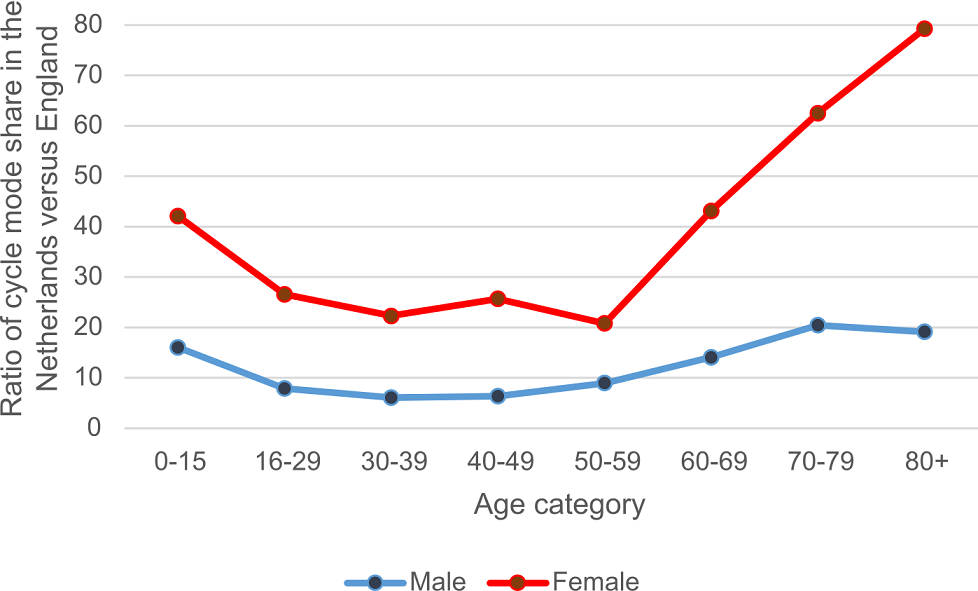
People in the Netherlands make 26.7% of trips by bicycle, fifteen times higher than the figure of 1.7% in England. In addition, cycling in England is skewed towards younger, male cyclists (Figure 2.1A). By contrast in the Netherlands cycling remains common into older age, and women are in fact slightly more likely to cycle than men (Figure 2.1B). This means that the difference between England and the Netherlands is particularly large for women and older people (Figure 2.2). For example, whereas the cycle mode share is ‘only’ six times higher in the Netherlands than in England for men in their thirties, it is over 20 times higher for women in their thirties or men in their seventies and eighties. For women in their seventies and eighties, the cycle mode share is over 60 times higher in the Netherlands than in England.
|
|
Figure 2.1: Proportion of trips cycled in England and Netherlands stratified by age and sex
|
|
|
Figure 2.2: Ratio of cycle mode share in the Netherlands versus England, stratified by age and sex
|
In both countries, the probability of cycling falls rapidly as trip distance increases. Interestingly, the shape of this distance decay relationship is generally similar between the two countries (Figure 2.3). In other words, the Dutch achieve their higher cycling levels by boosting the relative probability that trips of all distances will be made by bicycle. This indicates that the potential to increase cycling levels in England exists for longer trips (≥ 10km) as well as for the shorter trips that are more often targeted in cycling interventions, perhaps through improved infrastructure or a more widespread adoption of electric cycles. The only noticeable difference between England and the Netherlands is that the Dutch are relatively more likely to cycle short trips ≤ 1.5 miles than the English. Plausibly, this reflects trips being cycled in the Netherlands that are more often walked in England.

|
|
Figure 2.3: ‘Distance decay’ curves in England and the Netherlands, showing the probability that a trip of a given distance will be cycled relative to a trip of 2 miles
|
3. Why focus on the fast routes?
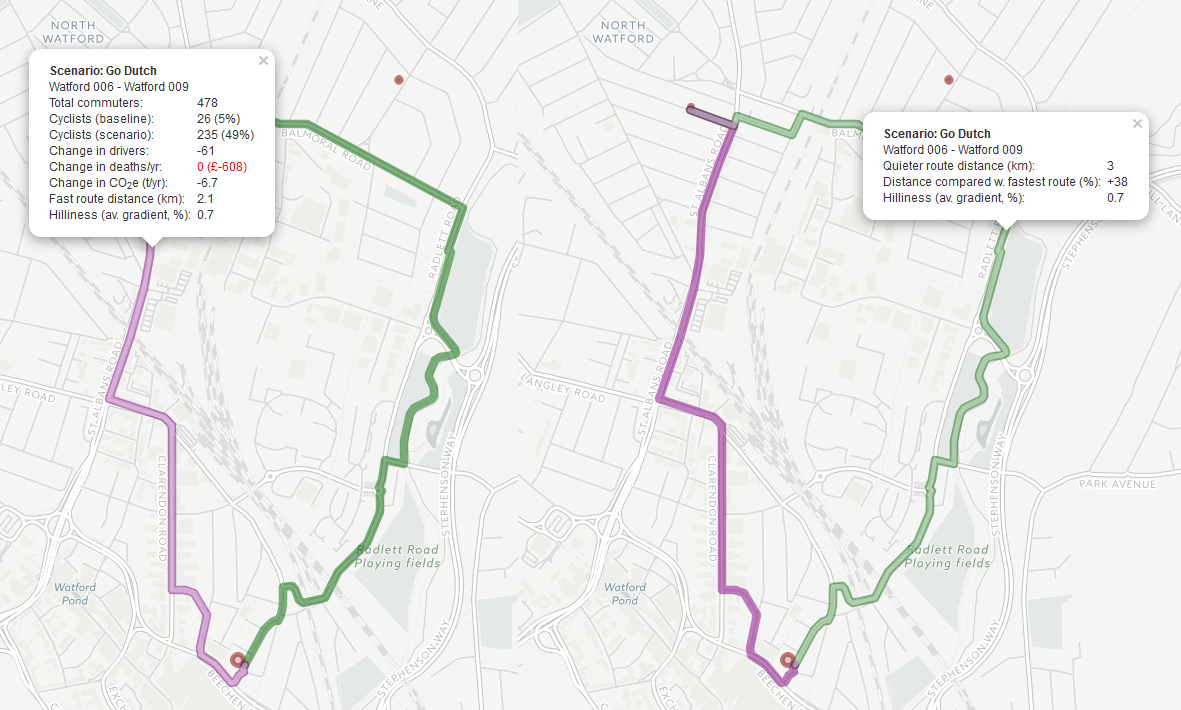
We give users the option of seeing either the ‘fast’ or the ‘fast’ and the ‘quieter’ routes on the map (see Figure 3.1 below). Which might cyclists use? These routes come from the journey planner Cyclestreets.net, which helps people plan their cycling route. CycleStreets.net shows three types of route, ‘fast’, ‘balanced’, and ‘quiet’. Many cyclists currently choose to take a quieter route at the cost of extra time because often the shortest route involves sharing with motor traffic on busy roads. However, even the quieter routes can still involve negotiating busy roads at times. The aim of the PCT is not to predict exactly where people are currently cycling. Rather we are trying to prioritise where to put new infrastructure.
For many people, cycling with busy traffic is hugely off-putting. A systematic review carried out for this project found this particularly puts off women, and probably also older people and those riding with children (Aldred et al 2017).
So are the quieter routes for those groups, and the fast routes for others? No, because this project also shows that propensity to cycle declines more rapidly with distance for women and older people. If a quieter route creates a detour such that a 2 mile trip becomes effectively a 3 mile trip, younger men’s propensity to cycle the route will decrease 11%. But for younger women, the decline is 19%, and for older adults (60+) the propensity would decrease by 35%.
This hits women’s and older men’s cycling twice: they are less likely than men to want to cycle the fast route, but then are also less likely to be willing to cycle an effectively longer alternative route. It’s likely to be part of the reason for disparities in cycling by age and gender.
Improving direct routes will reduce the impact of these safety and time disincentives to utility cycling. So while a good proportion of current cyclists may use the ‘quieter’ route, a big increase in capacity will likely necessitate substantial improvements to the ‘fast’ route, which will then carry many more riders. It is for these reasons that we have chosen to present the ‘fast’ as the most first choice for creating good cycling routes.
|
|
Figure 3.1: Fast and Quieter Routes between two zones.
|
4. What if I'm interested in trips not people? And does PCT account for return trips?
The PCT presents results in terms of numbers of people travelling to work or school in different ways – e.g. the number of commuters cycling to work in different scenarios. This is in line with the input data we are using from the Census (for commuting) and the National School Census (for school travel).
We appreciate some users will be more interested in numbers of trips than numbers of people. We recommend estimating numbers of trips affected as: Change in number of people * mean cycling trips per cyclist per week * 52.2 weeks in the year
The change in the number of people (e.g. an increase in cyclists or a decrease in drivers) is given in the PCT outputs. We estimate mean number of cycling trips per cyclist per week from the National Travel Survey (2010-2016) as:
- 5.1 for commuters who say cycling is their usual mode of travelling to work
- 2.3 for primary school children whose parents say cycling is their usual mode of travelling to school
- 5.1 for secondary school children whose parents say cycling is their usual mode of travelling to school
Note that all these values are much less than 10, i.e. one cannot assume all commuter and schoolchild cyclists make five return trips per week across the year. This is because of factors including part-time working; holiday periods; and cyclists using other modes for some journeys.
We have ourselves used a very similar method for the purposes of calculating physical activity benefits and carbon emission savings - see User Manuals C1 and C2. The only difference is that for the commuting layer we do not use the total population value '5.1' but instead used equivalent values calculated separately by age and gender (range 4.1-5.5).


